|
|
| |
|
Financial Performance
|
| |
|
|
|
|
|
|
|
|
|
Rs. In millions |
|
Indicator |
2017-18 |
2018-19 |
2019-20 |
2020-21 |
2021-22 |
2022-23 |
|
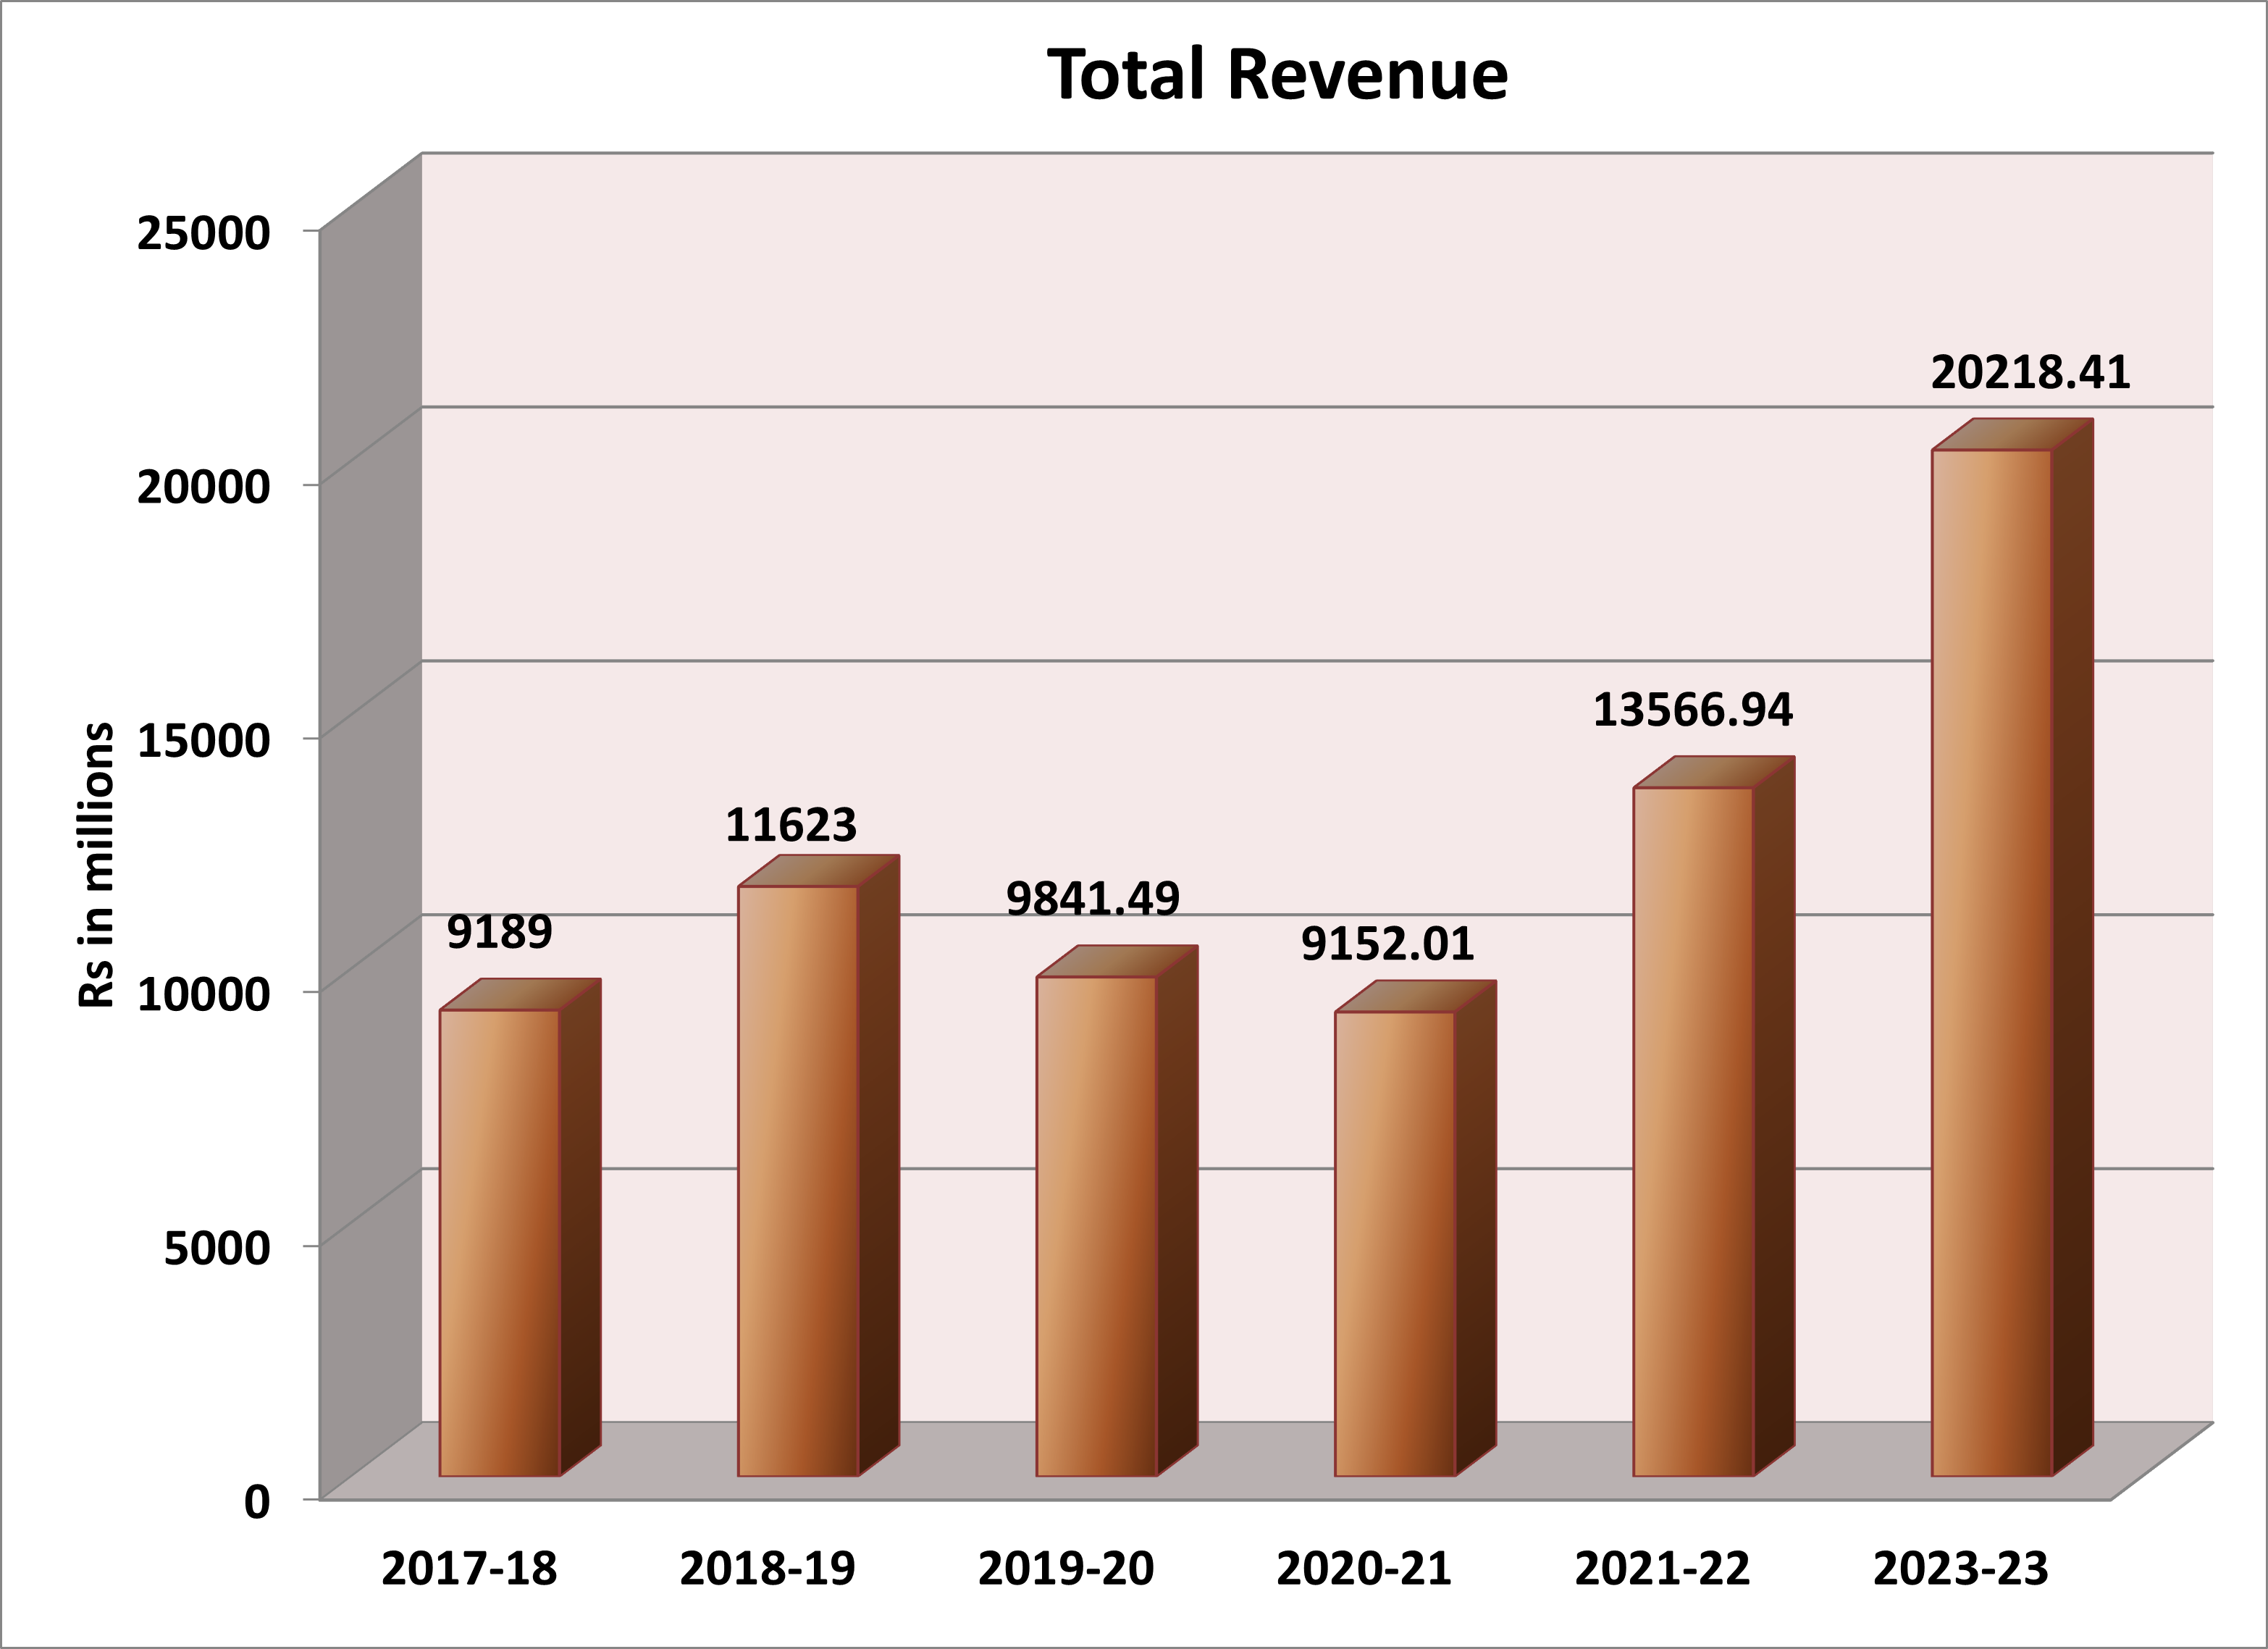
Total Revenue |
9188.75 |
11622.95 |
9841.49 |
9152.01 |
13566.94 |
20218.41 |
|
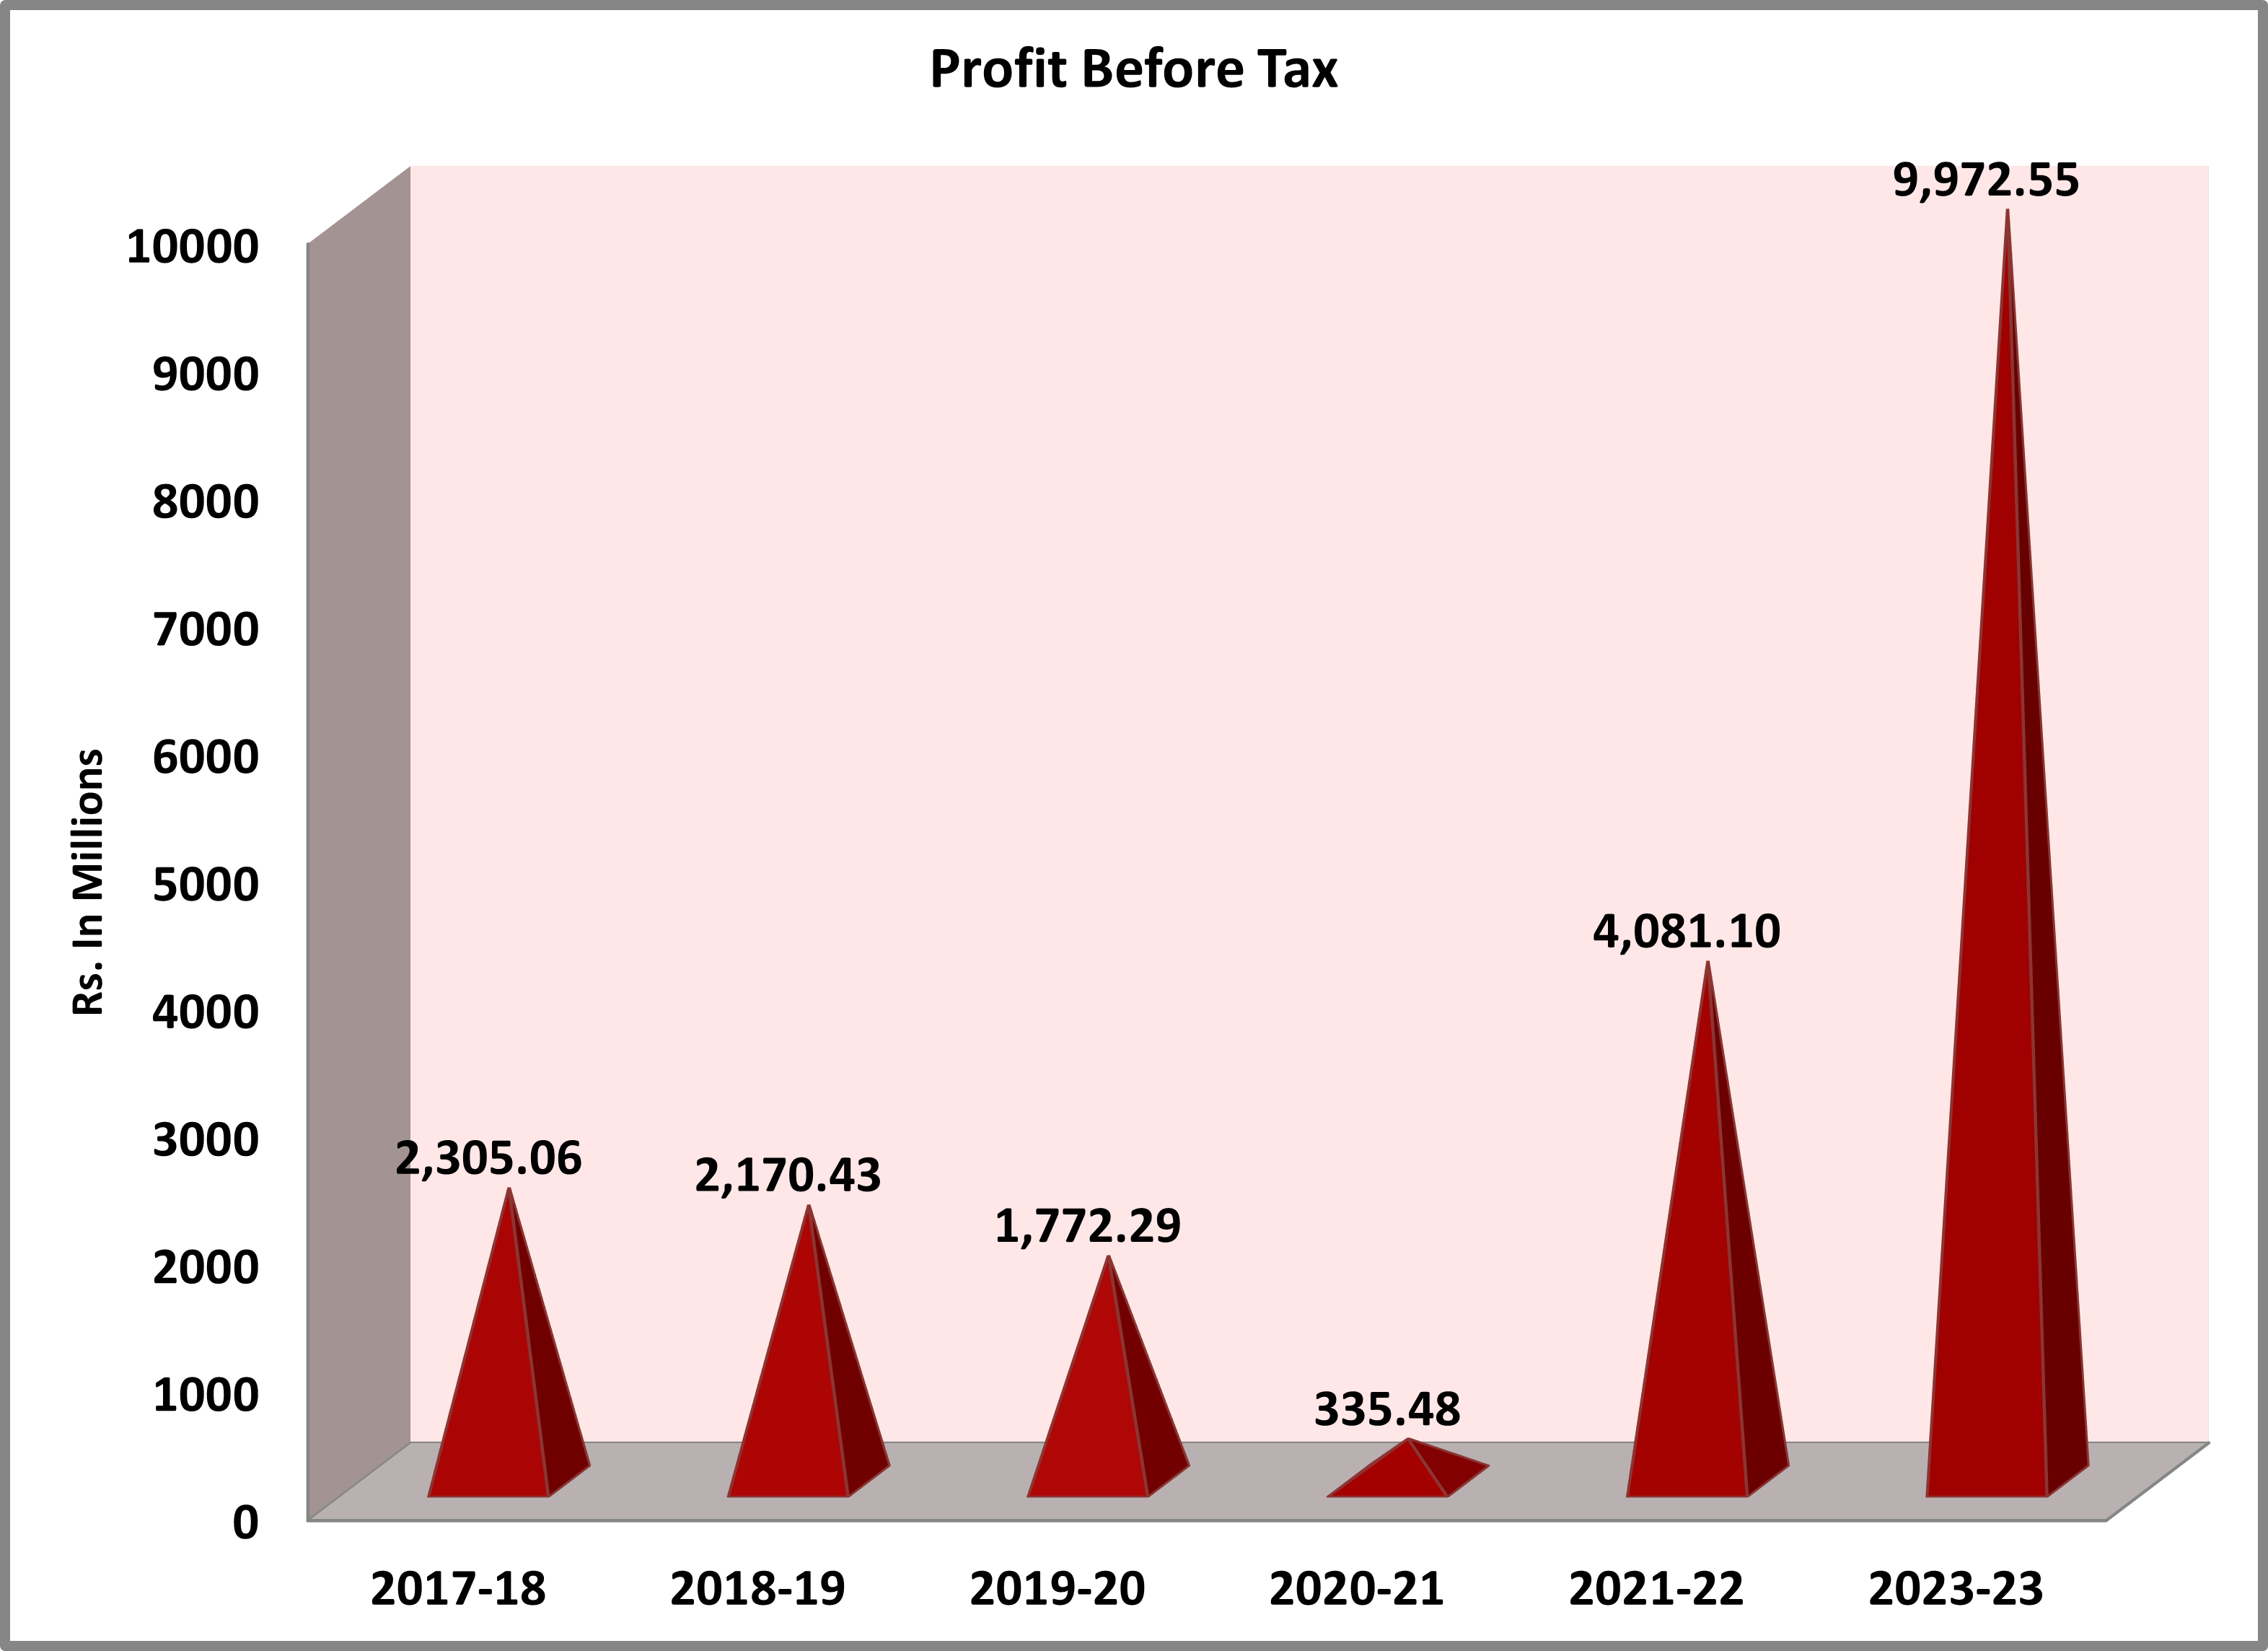
Profit Before Tax |
2305.06 |
2170.43 |
1772 |
335.48 |
4081.10 |
9972.55 |
|
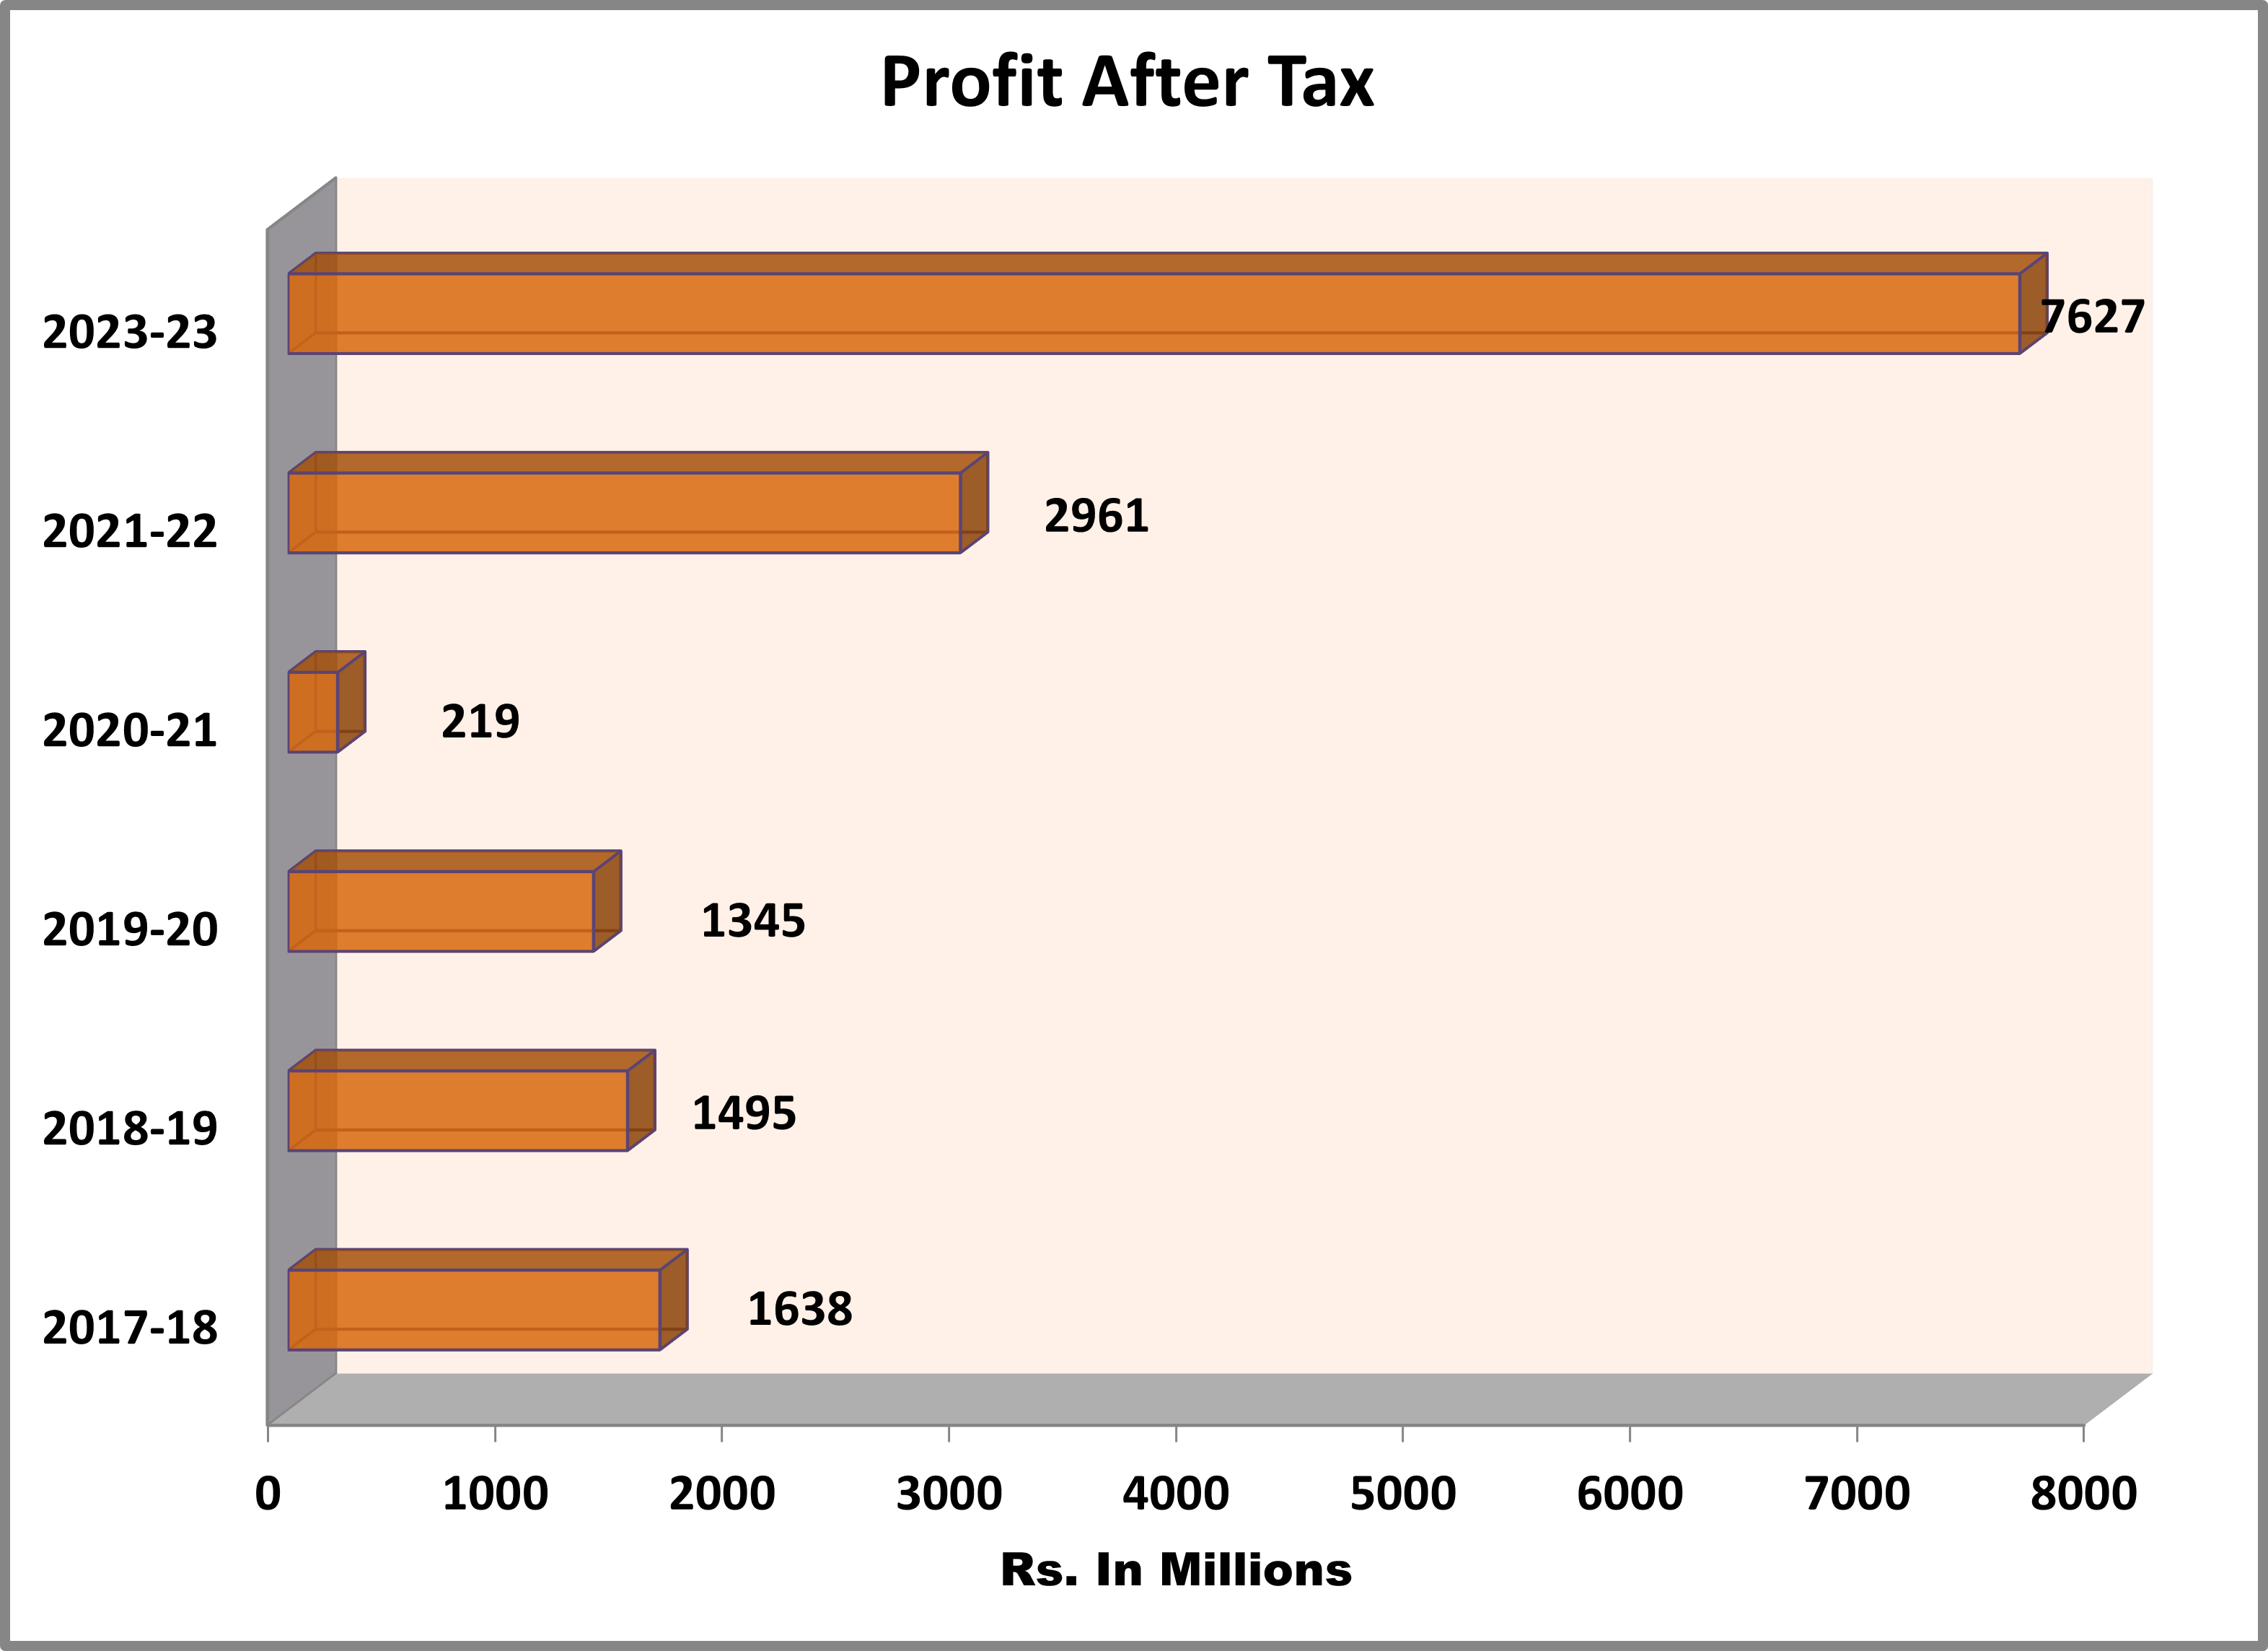
Profit After Tax |
1637.77 |
1495.20 |
1345 |
218.58 |
2961.27 |
7626.79 |
|
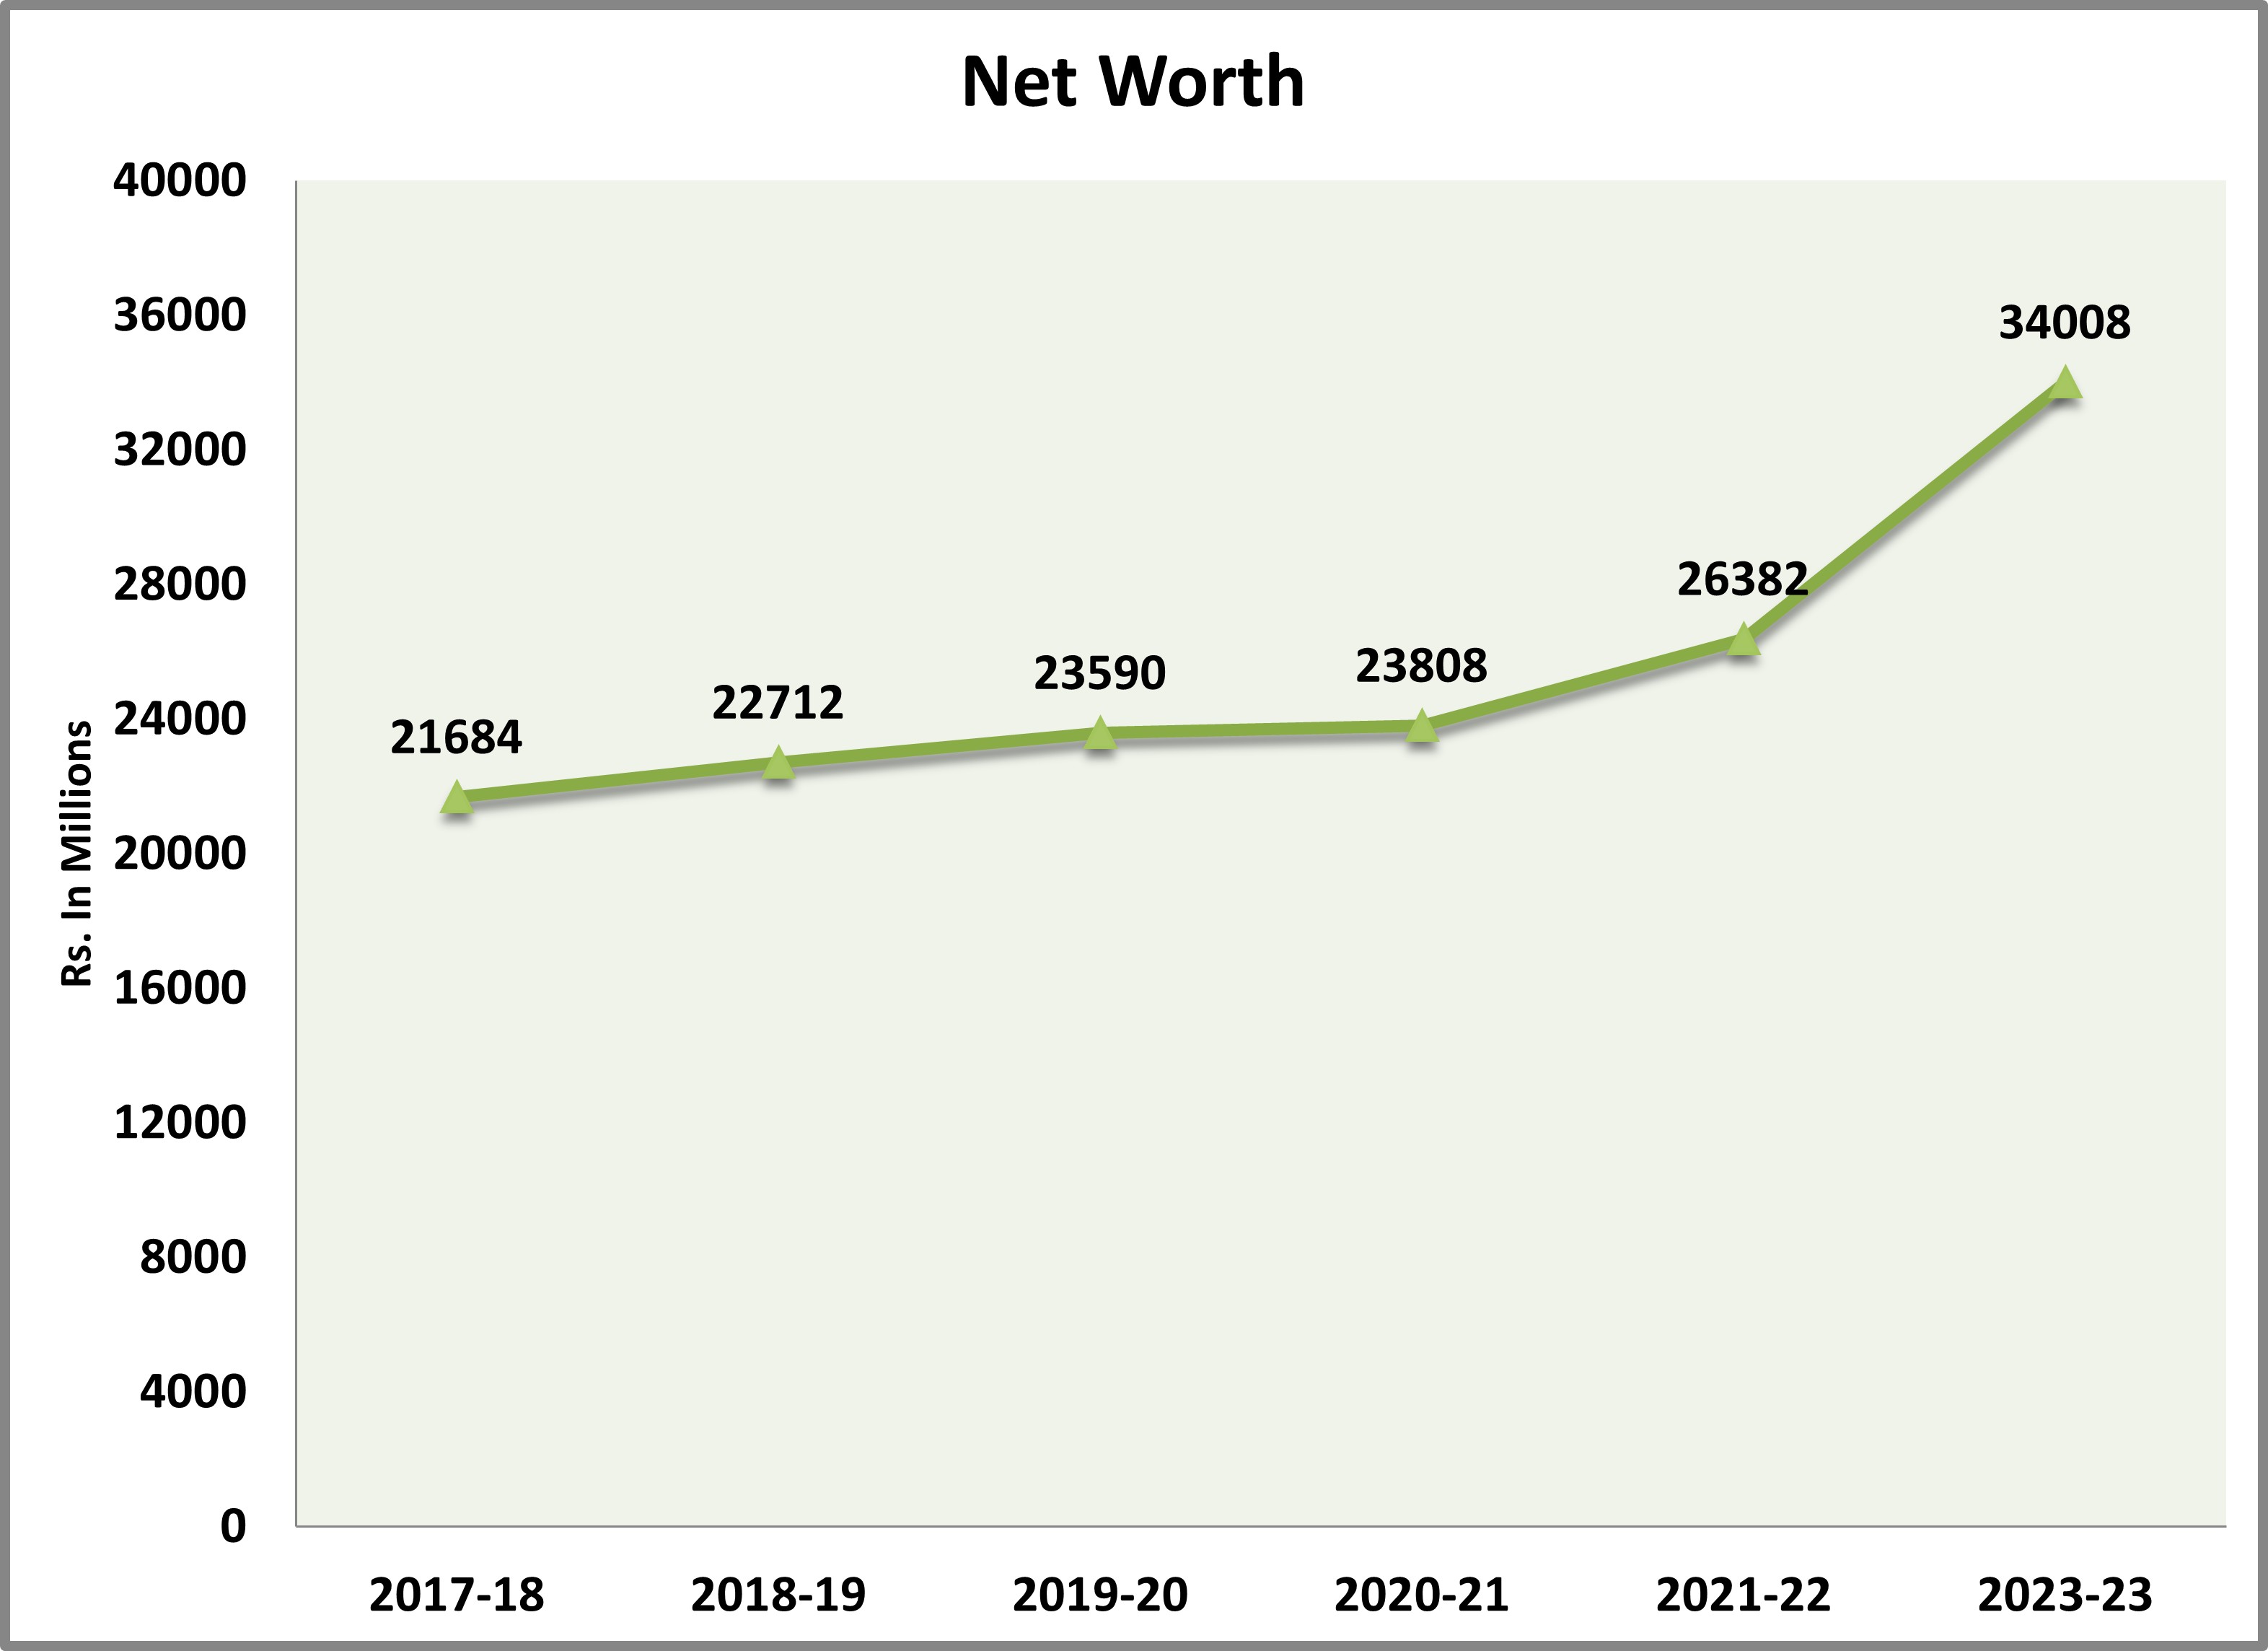
Net Worth |
21683.8 |
22711.5 |
23590 |
23808.00 |
26381.63 |
34008.42 |
|
Capital Employed |
18601.37 |
19607.27 |
18858.85 |
19274.20 |
21667.93 |
27897.91 |
|
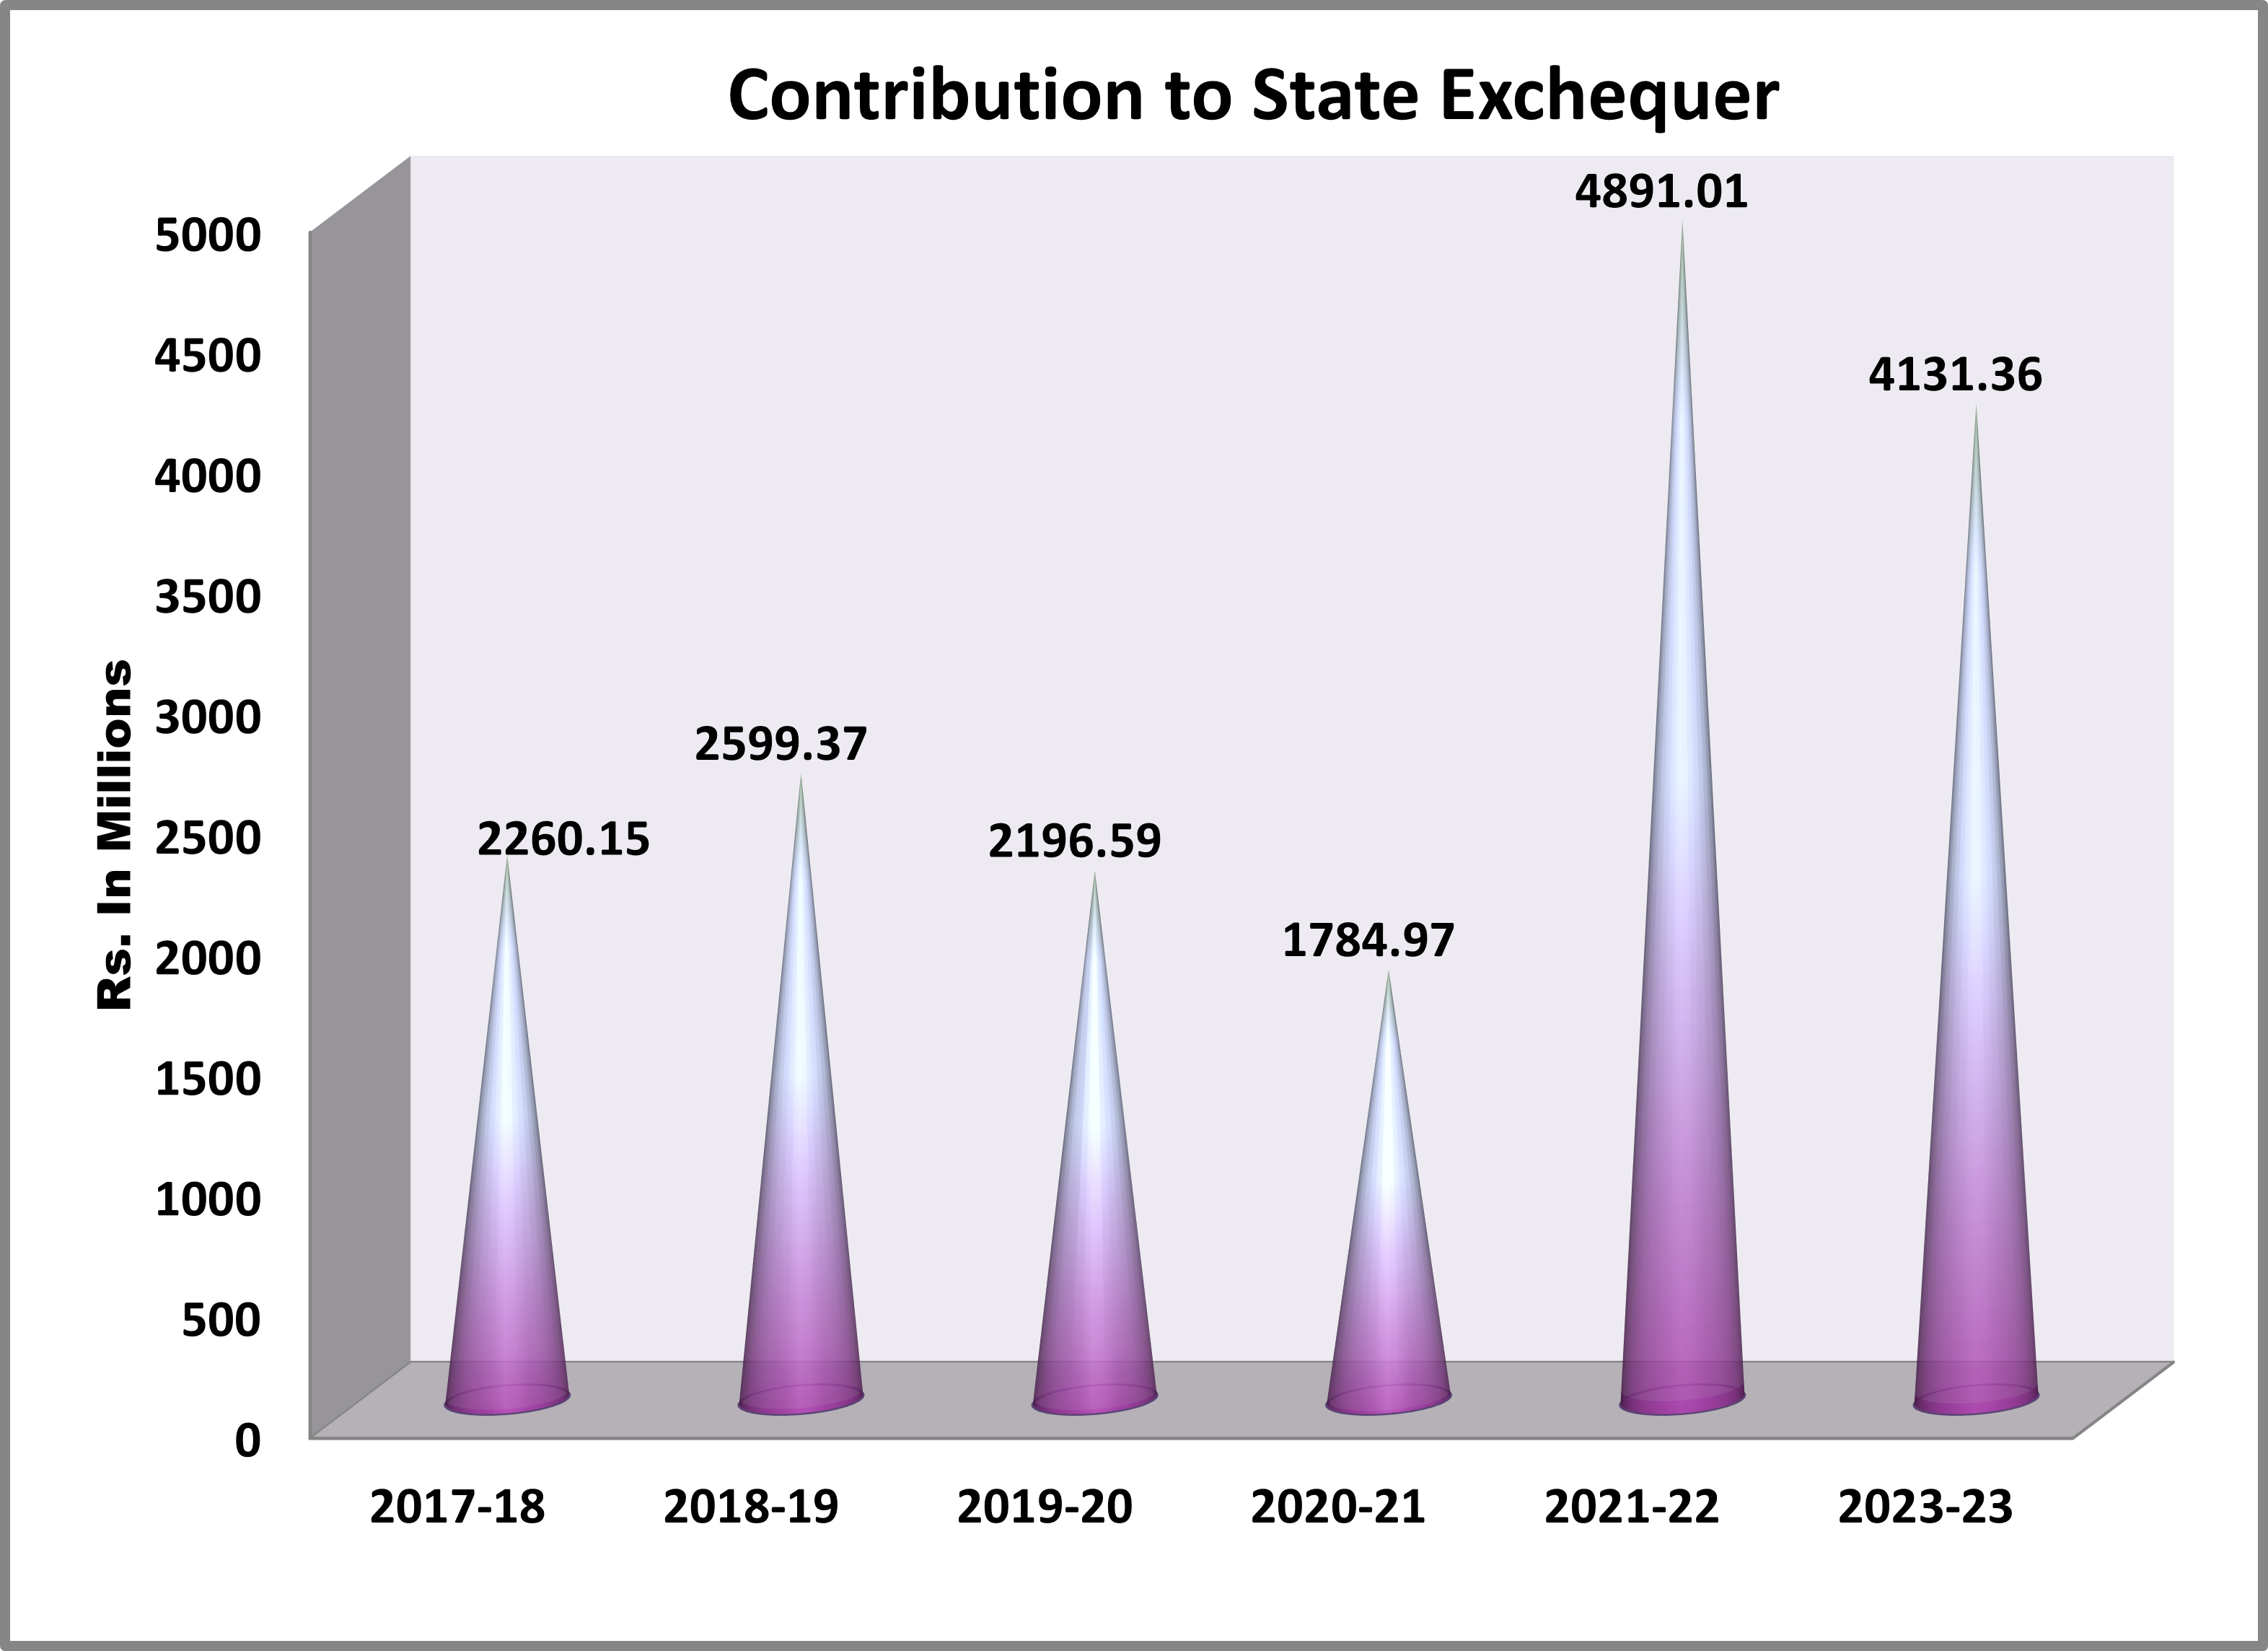
Contribution to State Exchequer |
2260.15 |
2599.37 |
2196.59 |
1784.97 |
4891.01 |
4131.36 |
|
Share Capital |
775.5 |
775.5 |
775.5 |
775.50 |
777.50 |
777.50 |
|
Earning per Share (Rs.) |
21.12 |
19.28 |
17.35 |
3.11 |
38.57 |
98.34 |
|
Revenue per Employee |
6.48 |
9.29 |
8.67 |
9.67 |
15.77 |
24.68 |
|
|


